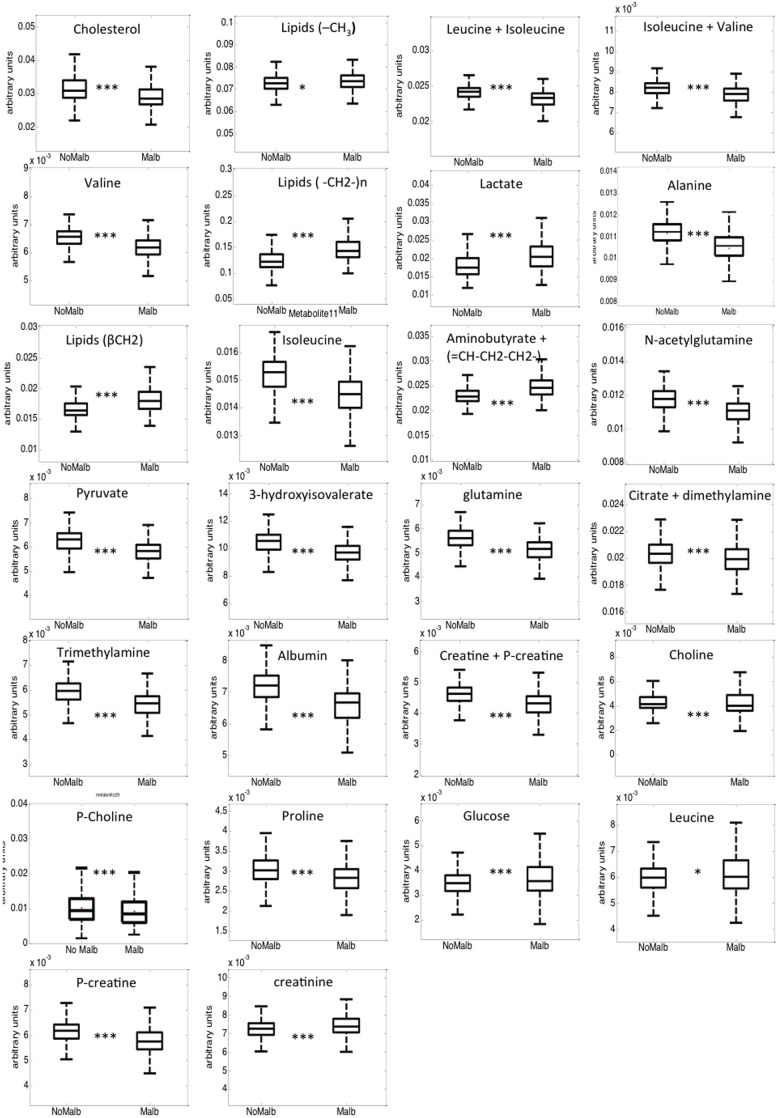
Figure 2. Box plots showing metabolite relative levels in blood serum of subjects without microalbuminuria (box in the left) and with microalbuminuria (box in the right).
Boxes denote interquartile range, lines denote median, and whiskers denote tenth and ninetieth percentiles. Levels are expressed as area of the metabolite of interest divided with respect total aliphatic spectral area. *, p-value<0.01; ***, p-value<0.00001.

