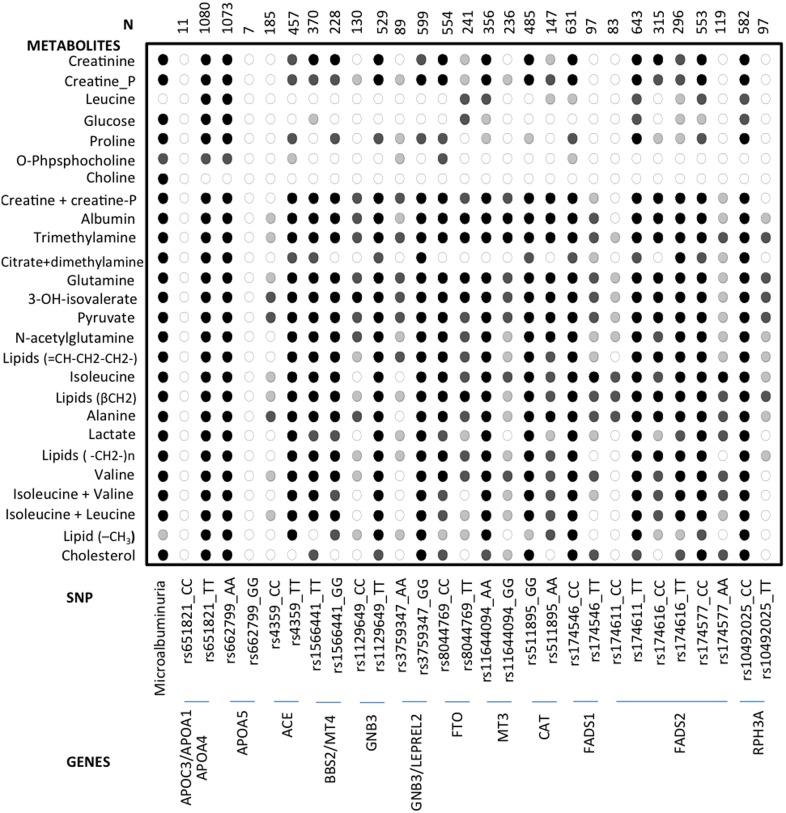
Figure 3. Patterns of statistical significance, calculated as p-values, for the comparison of metabolic profiles between normoalbuminuria and microalbuminuria in the whole population (first column) and in individuals with different SNPs (rest of the columns).
(○) p>0.01; (light grey circle) p<0.01; (dark grey circle) p<0.001; (•) p<0.00001. Percent of microalbuminuria in each genotype is included between brackets ().

