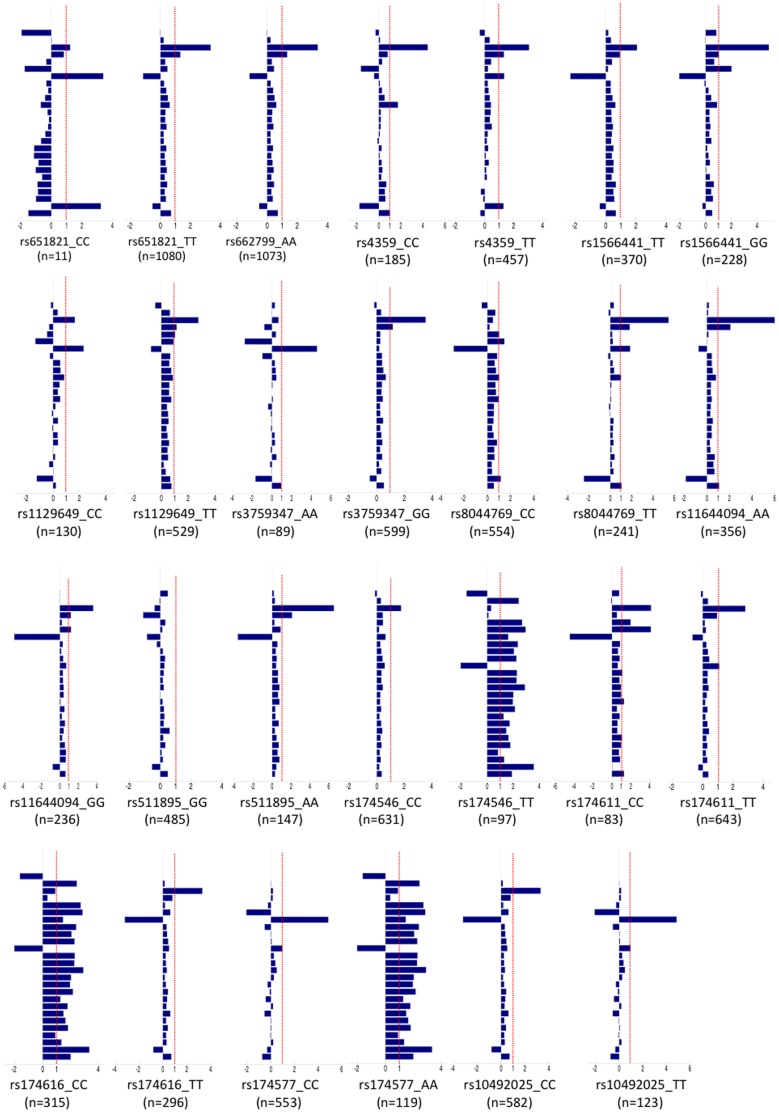
Figure 4. Bar chart showing metabolic differences between microalbuminuria and no microalbuminuria normalized with respect to changes in the entire cohort.
The bars represent the difference in the average metabolic levels between microalbuminuria and no microalbuminuria for each SNP divided by the same difference calculated for the entire cohort. SNPs with bars closer to 1 (dotted line) show UAE associated metabolic changes similar to those of the global population (irrespective of genotype). On the other hand, SNPs with bars closer to 0 exhibit minimal or no metabolic changes associated to UAE. Bars with negative values indicate a UAE associated metabolic change opposite to that detected in global population. Metabolites from top to bottom are: creatinine; creatine phosphate; leucine; glucose; proline; phosphocholine; choline; creatine+creatine phosphate; albumin; trimethylamine; citrate+dimethylamine; glutamine; 3-hydroxyisovalerate; pyruvate; N-acetylglutamine; lipids ( = CH-CH2-CH2-)+aminobutyrate; isoleucine; lipids (βCH2); alanine; lactate; lipids (-CH2-)n; valine; valine+isoleucine; leucine+isoleucine; lipids (-CH3) and cholesterol.

