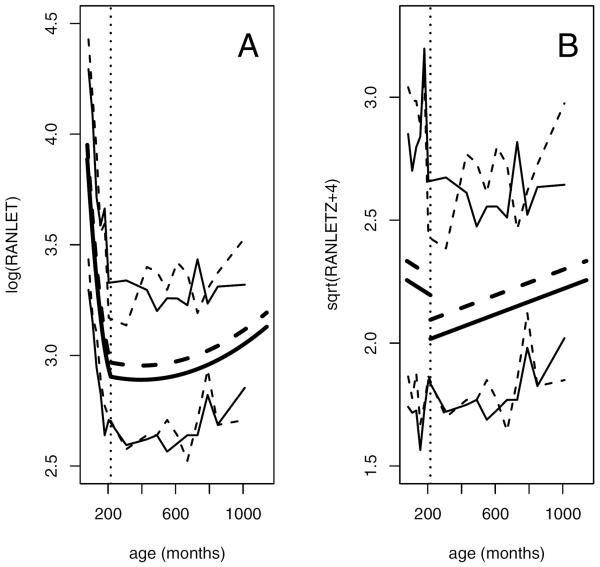
Figure 1.
Illustration of the relationship between the observed RAN letters scores and age. A raw scores, B grade-normed scores, with (- - -) representing males and (—) representing females. The best fitting model is represented by the thicker middle lines, while the thinner top and bottom lines represent a summary of the data computed by finding the 95th and 5th percentiles of the RAN letters scores binned by age. Bin sizes are 24 months in youths and 60 months in adults, with larger bins of size 184 and 260 months in the youngest and oldest adults, due to the small number of individuals sampled in these age ranges. For an illustration using all data points, see Supplementary Figure 1. The vertical dotted line delineates the age (18 years) used to separate youths and adults.

