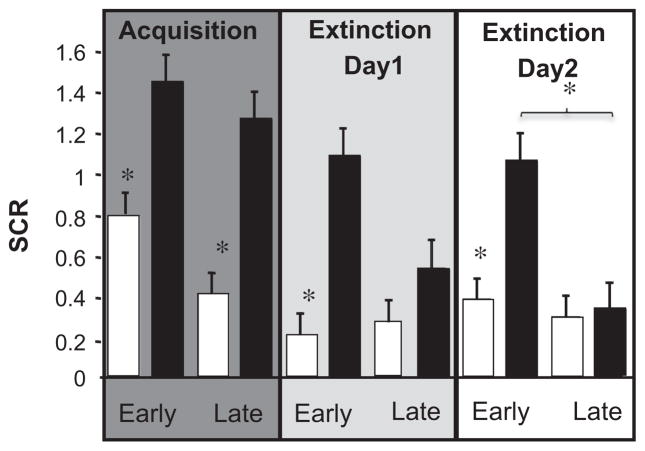
Fig. 1.
Skin conductance response (SCR) during auditory threat learning. Square root transformed mean SCR to the CS+ (black bar) and CS− (white bar) averaged for all subjects (n = 16) across acquisition, day 1 and day 2 extinction. Data is divided into an early (19 trials of each stimulus) and late phase (19 trials of each stimulus) for each session. Asterisks represent a significant difference (P < 0.01) of CS+ vs. CS−, and during extinction between CS+ in early vs. late extinction.

