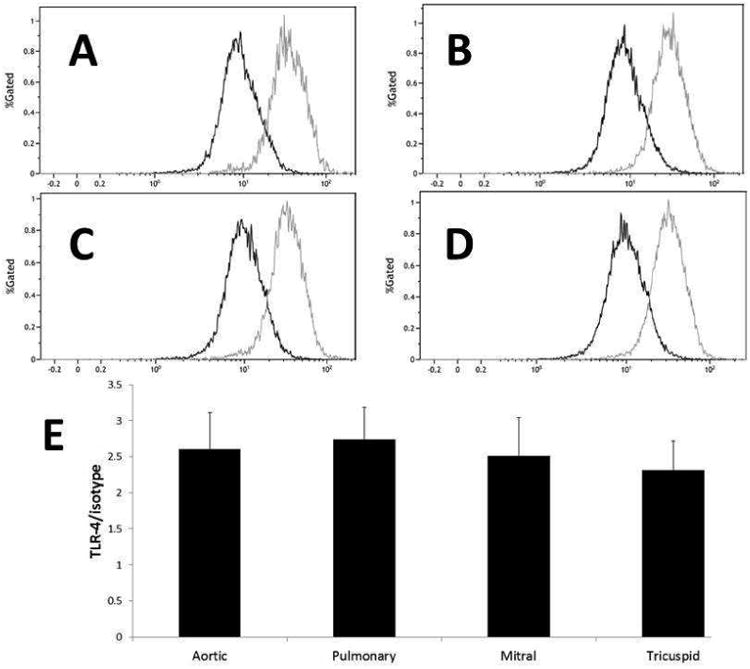
Figure 3.

VICs express similar surface levels of TLR-4. VICs were digested with trypsin/TNS and conjugated with antibodies to TLR-4 PE or Isotype control. The gray line in each flow cytometry plot represents TLR-4 antibody results compared to the isotype (darker line). Data are presented for the aortic (A), pulmonary (B), mitral (C), and tricuspid (D) VICs. The graph represents the ratio of the median of the mean fluorescence intensity normalized to the isotype control (E). Ratios did not differ significantly among VICs for each valve, indicating a similar surface concentration of the TLR-4 receptor.
