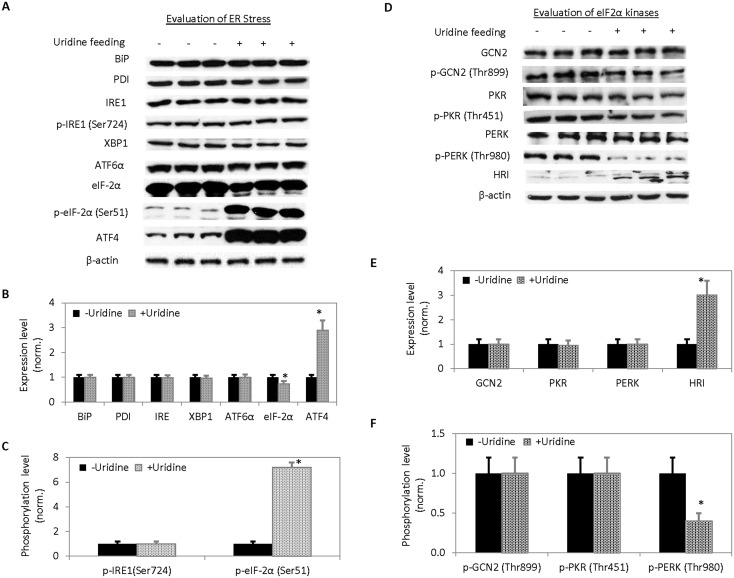
Figure 2. Evaluation of the effects of uridine on ER stress and regulation of eIF-2α.
(A) Western blots of protein unfolded response sensors. (B, C) Quantitative analysis of protein expression levels (B) and phosphorylation levels (C) of UPR sensors. (D) Western blots of eIF-2α kinases. (E, F) Quantitative analysis of protein expression (E) and phosphorylation (F) levels of eIF-2α kinases. Error bars are standard deviations across 9 liver samples evaluated. Asterisks indicate P<0.05 versus untreated control C57BL/6J mice.

