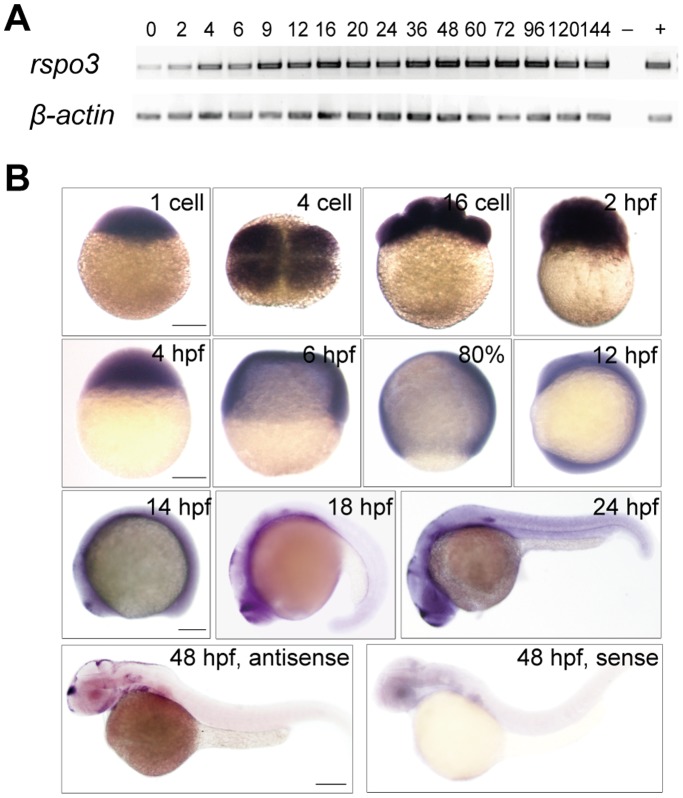
Figure 2. The spatiotemporal expression pattern of zebrafish rspo3.
(A) RT-PCR analysis of zebrafish rspo3 mRNA at the indicated embryonic stages. Numbers indicate different developmental stages as hours post fertilization (hpf). β-actin as internal control. −, negative control; +, positive control. (B) Whole-mount in situ hybridization analysis of zebrafish rpso3 mRNA at the indicated stages. All panels are dorsal, top, or lateral views with animal pole up or anterior to the left. Scale bars = 200 µm.

