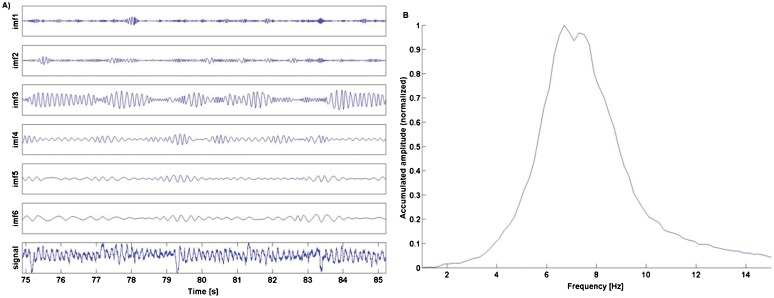
Figure 2. Empirical Mode Decomposition and Marginal Hilbert spectrum.
(A) Empirical mode decomposition with intrinsic mode functions (IMF) 1–6 and the original signal for patient 1 with IMF 3 containing the tremor signal. (B) Marginal Hilbert amplitude spectrum of IMF 3 for patient 1 playing the G major scale condition. The main frequency (peak value) was 6.7 Hz.

