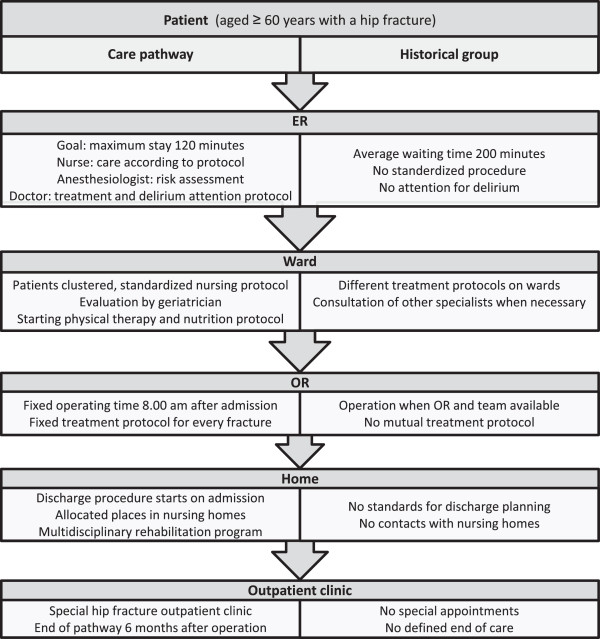
Figure 1.

Flow chart of the treatment in both groups. Schematic representation of the differences between the treatment in the intervention group (comprehensive care pathway) and the historical control group (standard care). For details, see text. ER: emergency room, OR: operating room.
