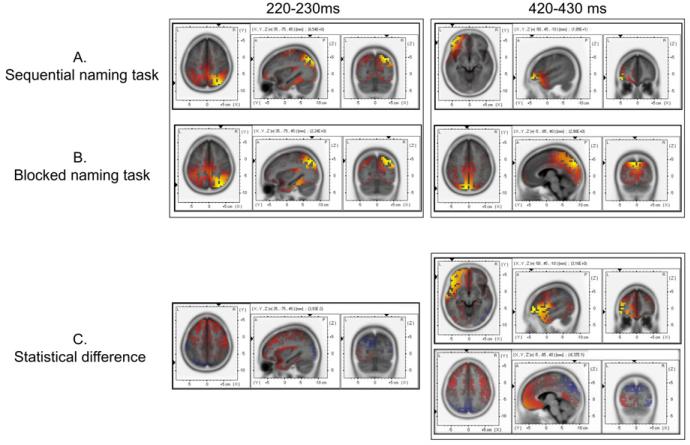
Figure 2.
sLORETA localization of the electrophysiological activity of the grand average for the sequential (A) and the blocked (B) naming protocols at 220-230 ms (top-left) and 420-430 ms (top-right) post-stimulus. (C) sLORETA statistical difference between conditions (based on the localizations computed for each participant in each protocol) for the same time windows and regions of interest. The differences observed were marginally significant across participants (p=.08 for 220-230ms; p = .07 for 420-430ms). Voxels in red correspond to stronger activity in the sequential naming protocol; voxels in blue correspond to stronger activity in the blocked naming protocol. Within each view, black arrows on the margins indicate the location of the two other views.

