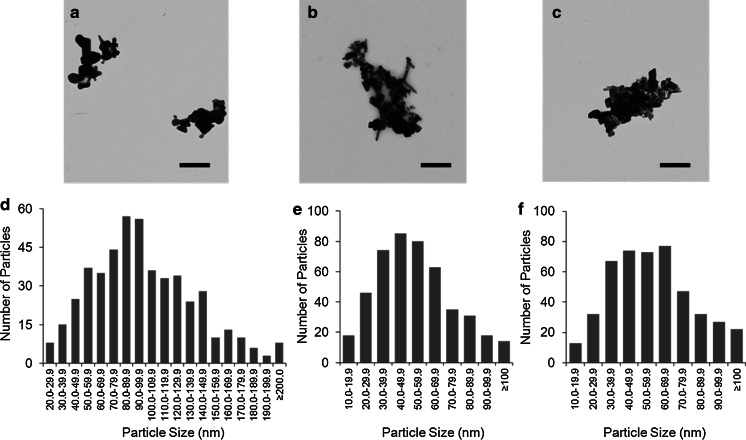
Fig. 1.
TEM images and size distribution of ZnO-NPs. TEM images: a fine-ZnO; b Z-COTE; c Z-COTE HP1. Each material was suspended in ddH2O, sonicated, deposited onto carbon-coated copper grids and allowed to air-dry for 24 h before examination. Z-COTE, Z-COTE HP1, and fine-ZnO appeared as crystalline rods or polygonal structures. Particle agglomeration was observed for all samples. Scale bar = 500 nm. Particle sizes were measured from the TEM micrographs of individual particles. Size distribution: d Z-COTE (ranging from 12 to 140 nm); e Z-COTE HP1 (ranging from 14 to 170 nm); f fine-ZnO (ranging from 20 to 300 nm)

