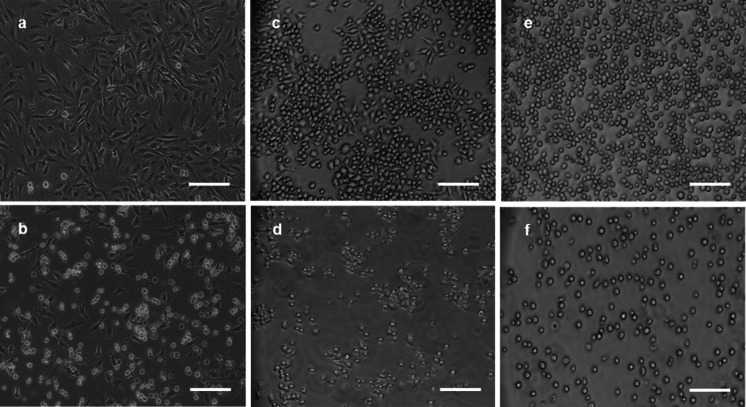
Fig. 2.
The effect of ZnO-NPs on cell morphology. After ZnO–NP exposure (25 µg/mL) for 24 h, treated cells were observed with a Nikon TE300 microscope. a, b FE1-MML cells. a non-treated cells; b Z-COTE-treated cells. c, d RAW 264.7 cells. c non-treated cells; d Z-COTE-treated cells. e–f LBRM-33 cells. e non-treated cells; f Z-COTE-treated cells. Exposure to a high concentration of Z-COTE altered the gross cell morphology (cell shape and detachment) of all mouse cell lines. Scale bar = 100 µm

