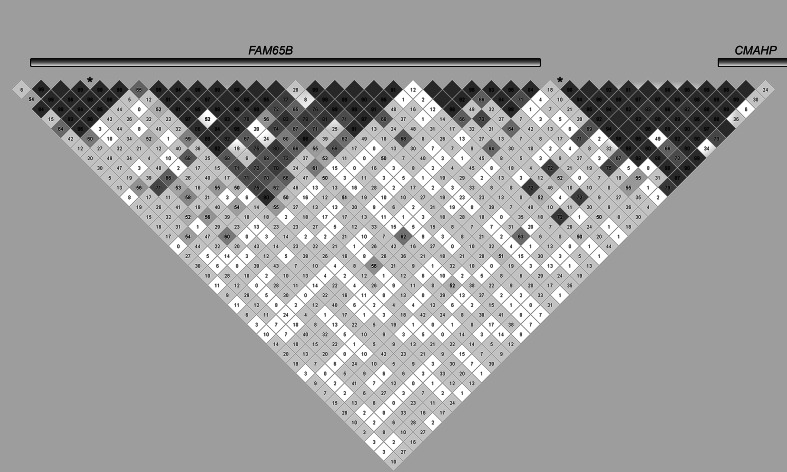
Fig. 3.
Linkage disequilibrium between associated markers and haplotypes in FAM65B and CMAHP for RD or verbal IQ. Asterisks represent single-marker associations. Numbered boxes show LD (as measured by D′) between markers. Genes are not drawn to scale; the size of a gene in the diagram depends on the number of markers in our panel that localize to that gene

