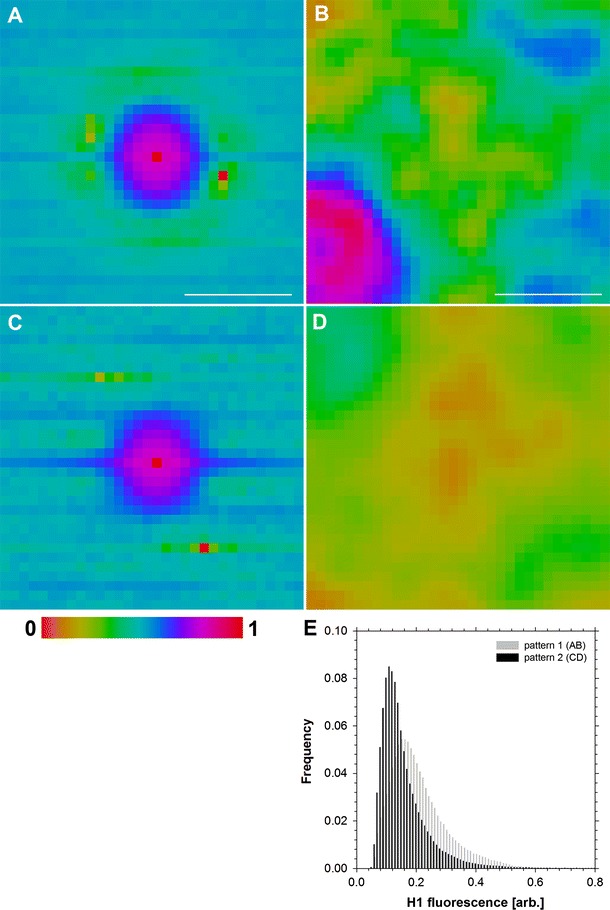
Fig. 3.

Patterns of autocorrelation (a, c) of H1 fluorescence fluctuations (RICS), revealing the transiently bound H1 fraction (a, c, central peak) and mobile H1 fraction (c, horizontal line). The corresponding spatial distributions of H1 (BD) were reconstructed with texture clustering. Fluorescence intensity histograms corresponding to both pattern types (a, c) are shown in panel e. Scale bar 10 µm
