
Fig. 1.
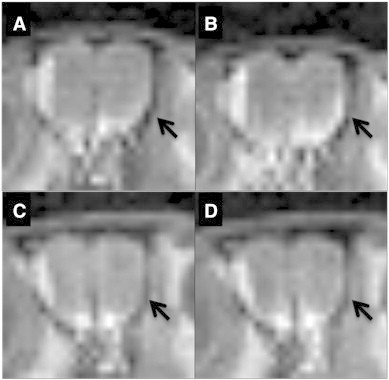
Representative images from olfactory bulb slices from MEMRI scans of WT first cycle (A) and last cycle (B) and rTg4510 mice first cycle (C) and last cycle (D) 10 month old mice. The left side of the olfactory bulb contains an artifact that is present throughout all scans. Arrows on the right hand side indicate changes in signal intensity throughout multiple cycles of MEMRI scans.