
Fig. 2.
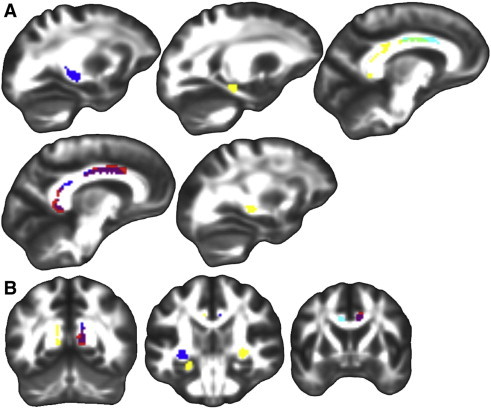
Fractional anisotropy group differences in ROIs. Significant group differences in fractional anisotropy within the three ROIs displayed on FSL's FMRIB58_FA template transformed to this study's population space. Regions where Aβ + had significantly higher FA than Aβ − (p(FWE) < .05, blue), Aβi had significantly higher FA than Aβ − (p(FWE) < .05, red), both Aβ + and Aβi had significantly higher FA than Aβ − (p(FWE) < .05, purple), Aβ + showed a trend of higher FA compared to Aβ − (p(uncorr) < .001, yellow), Aβi showed a trend of higher FA compared to Aβ − (p(uncorr) < .001, cyan), and both Aβ + and Aβi showed a trend of higher FA compared to Aβ − (p(uncorr) < .001, light green). A.) Sagittal slices from left to right. B.) Coronal slices from posterior to anterior. Left is on the left.