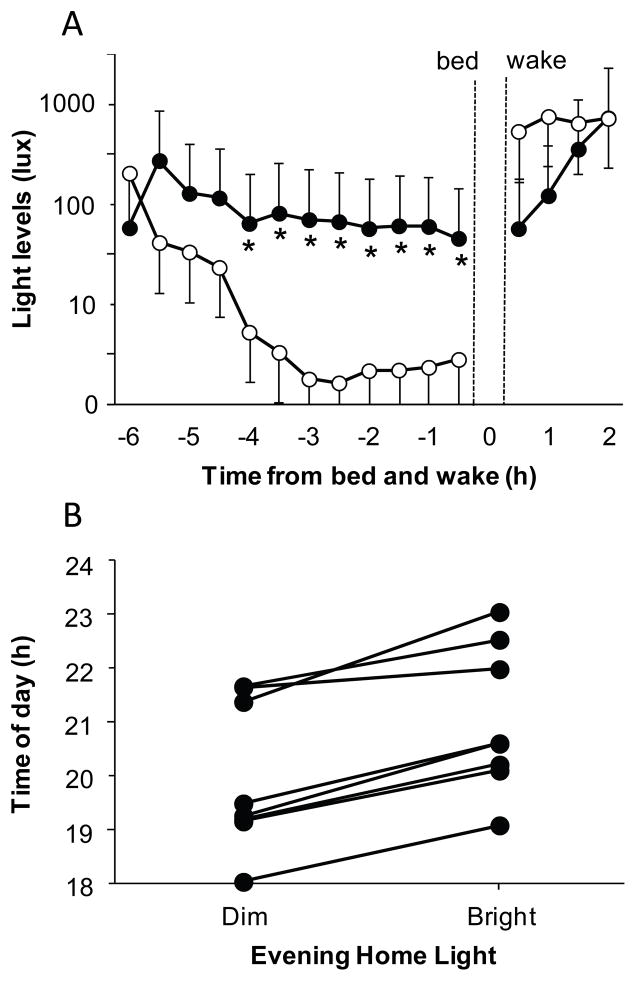
Figure 1.
A. Mean light levels in the hours before self-selected bedtime and after self-selected wake time. Asterisks indicate when the light intensity in the bright condition (closed circles) was significantly different to the light intensity in the dim condition (open circles; paired t-tests, all p≤0.024). Data is in 30 minute bins and error bars represent SEs. The brighter morning light in the dim condition was not significant, and was due to one subject going outside shortly after wake time on two mornings. B. The dim light melatonin onsets (DLMOs) observed in each individual subject after a week of dim evening or bright evening light at home. The DLMOs for each subject are connected by a line. All subjects had later DLMOs after the week of bright home light (p<0.001).

