
Figure 1.
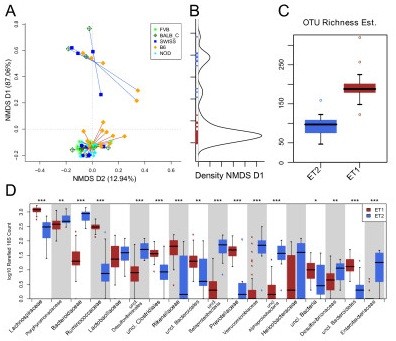
Enterotype clusters detected in the data. (a) Nonmetric multidimensional scaling (NMDS) at the genus level shows two clusters in the dataset. (b) The density of the first NMDS axis that explains most of the variation (92.5%) and shows a bimodal distribution with only few intermediate samples. (c) The operational taxonomic unit (OTU) richness estimate (chao1) between these two clusters differs substantially and (d) the two clusters are dominated by different taxa, with enterotype 2 being dominated by Bacteroidetes and Enterobacteriaceae and enterotype 1 being driven by Runinococcus and Lachnospiraceae. Significances are shown by asterisks: *q < 0.1 and P < 0.05; ** q < 0.05; ***q < 0.01.