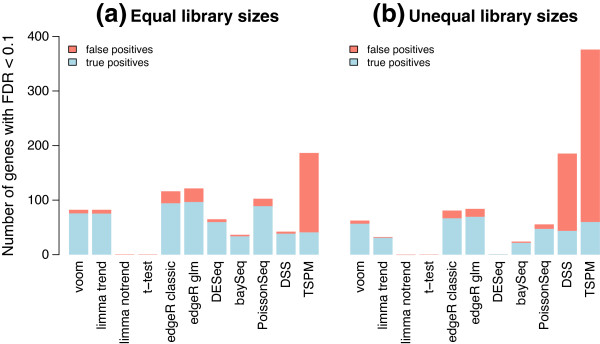
Figure 4.

Power to detect true differential expression. Bars show the total number of genes that are detected as statistically significant (FDR < 0.1) (a) with equal library sizes and (b) with unequal library sizes. The blue segments show the number of true positives while the red segments show false positives. 200 genes are genuinely differentially expressed. Results are averaged over 100 simulations. Height of the blue bars shows empirical power. The ratio of the red to blue segments shows empirical FDR. FDR, false discovery rate.
