
Figure 5.
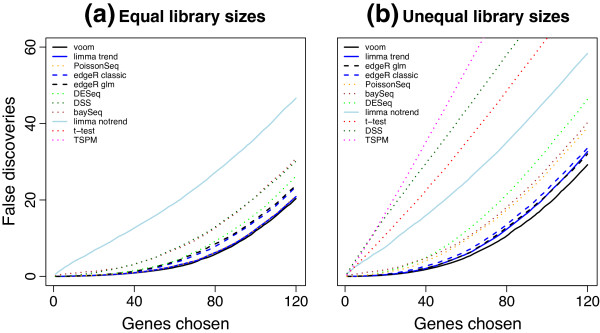
False discovery rates. The number of false discoveries is plotted for each method versus the number of genes selected as differentially expressed. Results are averaged over 100 simulations (a) with equal library sizes and (b) with unequal library sizes. voom has the lowest FDR at any cutoff in either scenario. FDR, false discovery rate.