Figure 6.

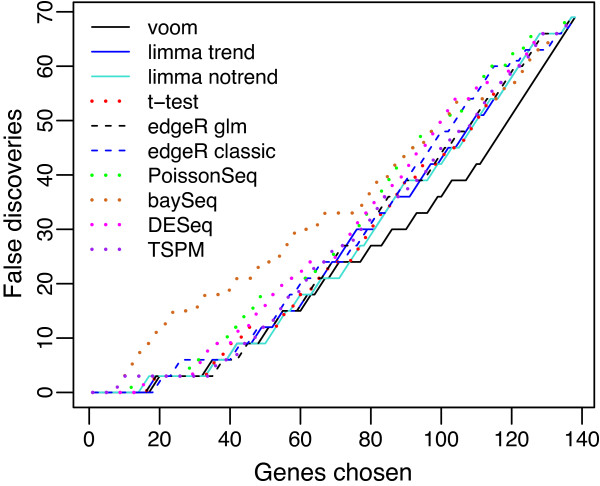
False discovery rates evaluated from SEQC spike-in data. The number of false discoveries is plotted for each method versus the number of genes selected as differentially expressed. voom has the lowest false discovery rate overall.

False discovery rates evaluated from SEQC spike-in data. The number of false discoveries is plotted for each method versus the number of genes selected as differentially expressed. voom has the lowest false discovery rate overall.