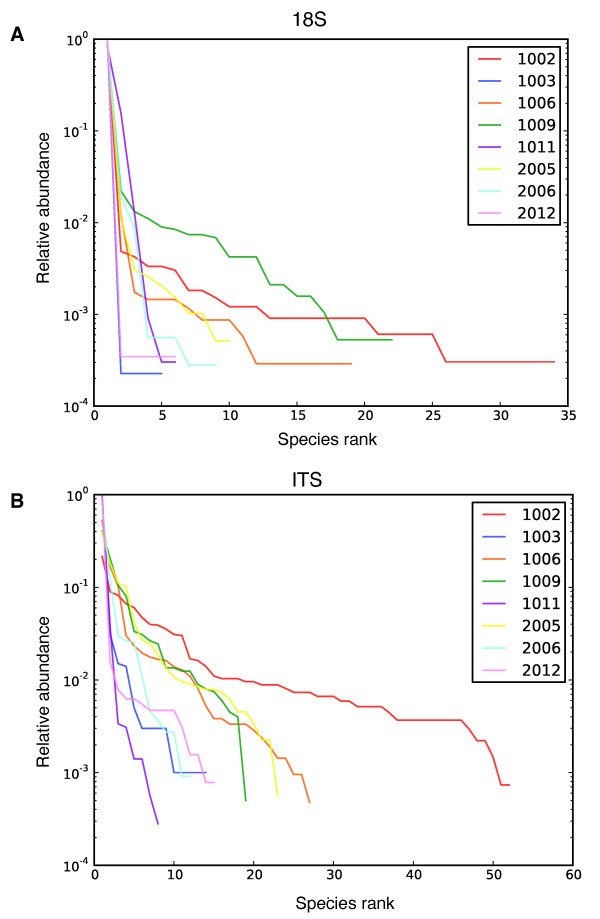
Figure 4.

Rank-abundance plots for operational taxonomic units from stool samples. (a) 18S rRNA gene amplicons. (b) ITS rRNA gene amplicons. The rank (relative abundance) of each OTU is shown on the x-axis, with the most abundant on the left. The proportion contributed by that OTU is shown on the y-axis. The key in the upper right shows the color code for the different human subjects studied.
