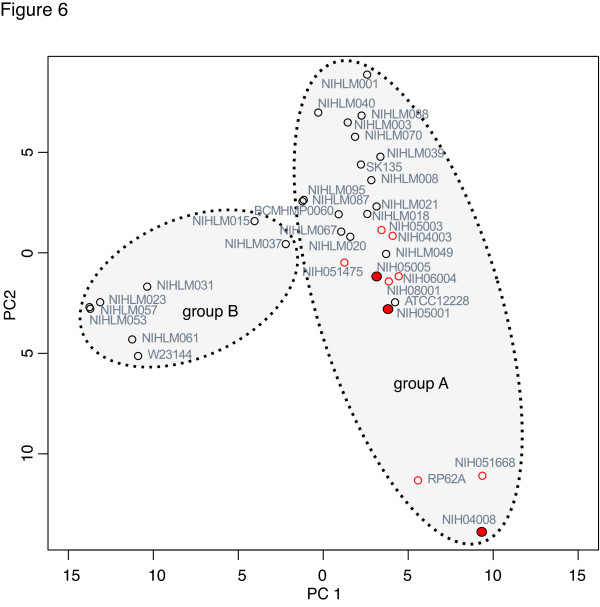
Figure 6.

Principal components anaylsis of ortholog clustering. The orthologous gene cluster data for 35 genomes was analyzed using principal components analysis. Nosocomial isolates are shown as red circles and ST2 nosocomial isolates are filled red circles. Commensal isolates are black circles. The dashed ovals indicate the phylogenetic groups described in Figure 4 but are not statistically defined. Percentages of variance explained by PC1 and PC2 are 13.8% and 9.1%, respectively.
