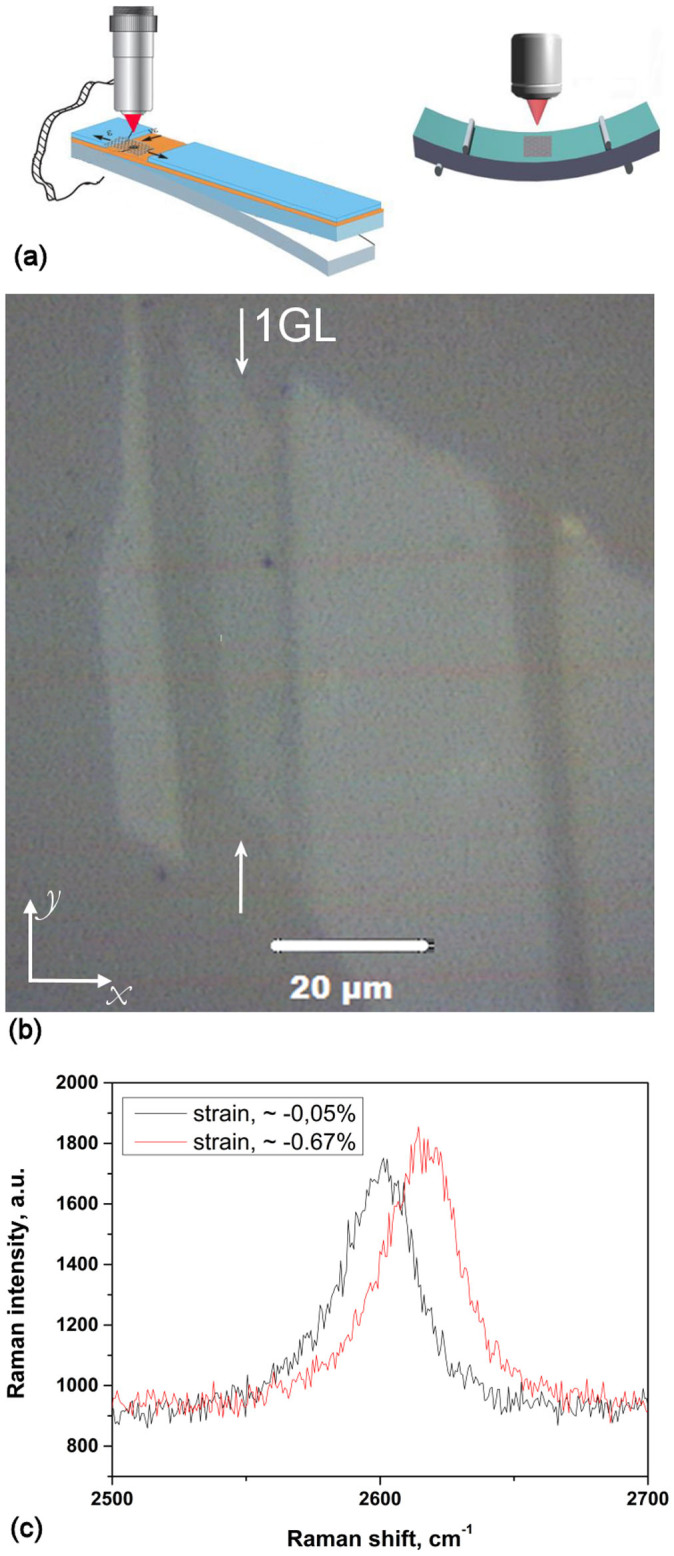
Figure 1.

(a) Experimental configurations of cantilever beam and 4 point bending setup employed for the execution of the experiments. (b) Image taken with an optical microscope; the flake dimensions were l = 11 μm and w = 50 μm (c) representative Raman spectra of the 2D peak measured at the onset of the experiment and just prior to failure. The shift to higher wave number is clearly seen. The graphene monolayer was loaded along the x-axis.
