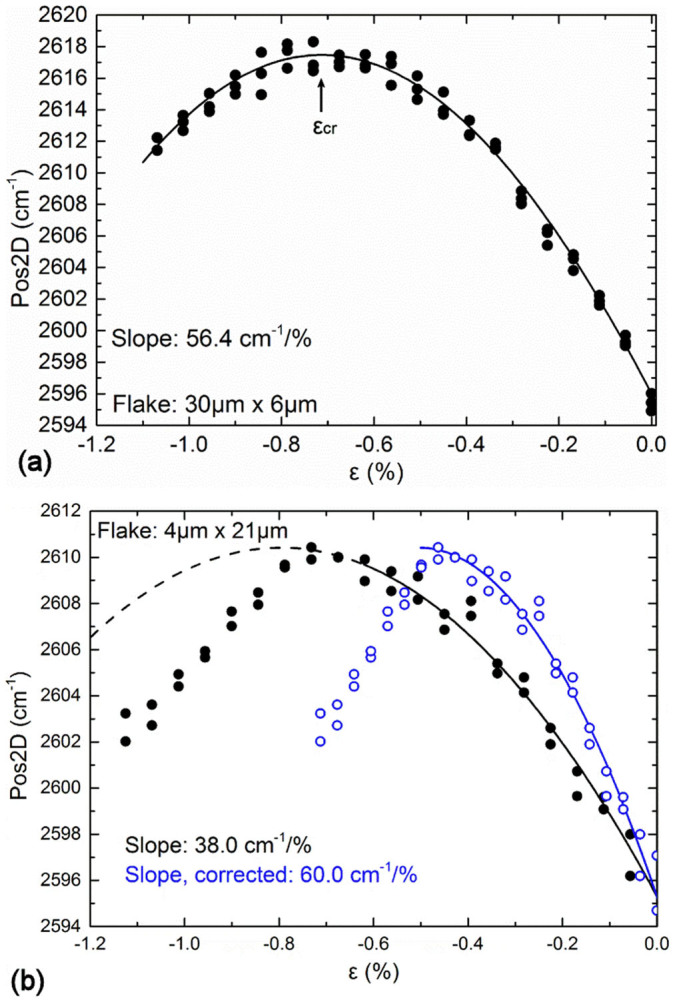
Figure 2.

(a)Typical curve of Raman wavenumber of the 2D peak versus applied strain for a flake with l = 30 μm and w = 6 μm.The line is a fourth order polynomial and fitting to the data is given by Pos2D = 2596 – 56.41ε– 29.54ε2 + 13.16ε3 + 4.01ε4. The plateau is clearly identified and the critical strain is calculated at 0.7%. (b) dependence of the 2D Raman peak on the strain for the flake with l = 4 μm and w = 21 μm. The solid circles correspond to the applied strain of the beam and the open circles represent the corrected strain values in accordance to equation 1. The black line is described by the Equation Pos2Dblack = 2595.3 – 38.0ε – 23.9ε2, and the blue line is a rescaling to a slope of 60 cm−1/%.
