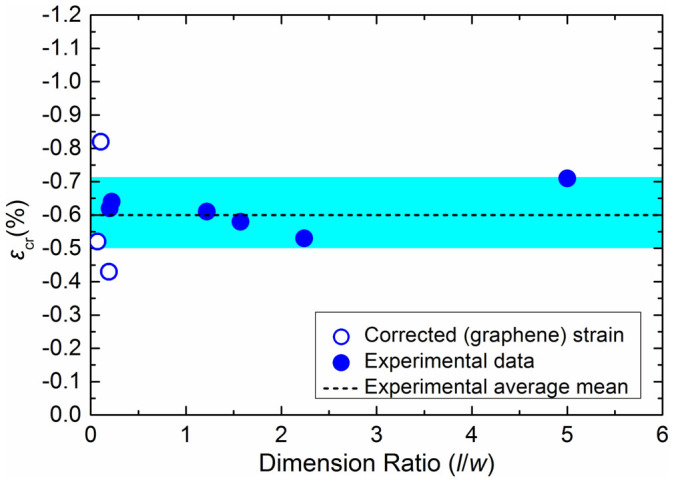
Figure 3. The experimental critical strain for buckling is plotted versus the dimensions' ratio l/w for monolayer graphene flakes.

The experimental mean value is shown with the dash line and corresponds to a Winkler modulus of 6.7 GPa/nm. The shadowed area corresponds to the zone that describes the standard deviation from the mean value (±0.11%).
