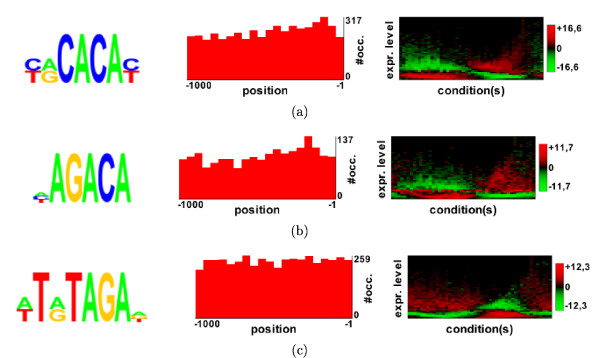
Figure 4.

The three highest scoring motifs found in the Bozdech analysis [11]. (Left) Motif logos. (Middle) Distance distributions according to the start codon. (Right) Profile heatmaps. The x-axis of this map represents the different conditions in the expression dataset, while the y-axis represents the expression level. The y-axis is divided into 25 bins, and the colors of the map indicate the motif density (expressed as a z-score) in each of these bins (red: high density; green: low density).
