
Figure 6.
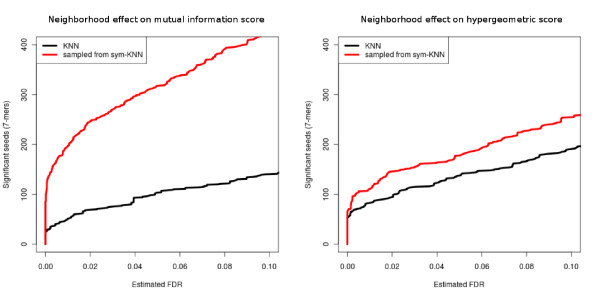
Effect of the neighborhood definition on the scoring function applied to the Gasch et al. dataset [21]. The y-axis is the number of significant seeds (7-mers) detected at different FDR thresholds (x-axis). (Left) Mutual information scoring function. (Right) Hypergeometric scoring function.