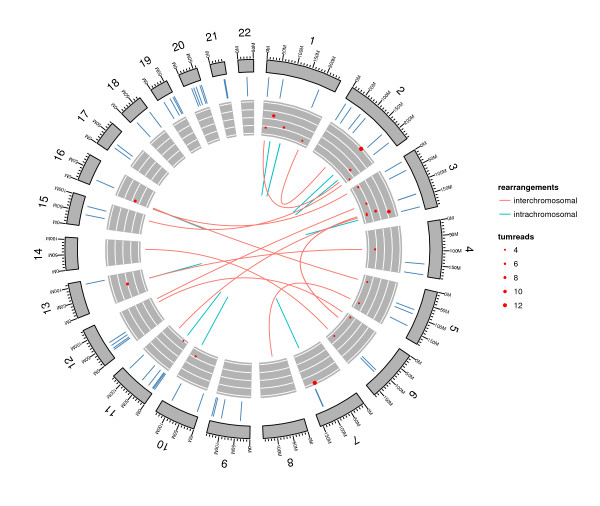
Figure 5.

Single sample circular view. DNA structural rearrangements and somatic mutation in a single colorectal tumor sample (CRC-1). The outer ring shows the ideogram of the human autosomes, labeled with chromosome numbers and scales. The segments represent the missense somatic mutations. The point tracks show score and support for rearrangement. The size of the points indicates the number of supporting read pairs in the tumor and the y value indicates the score for each rearrangement. The links represent the rearrangements, where intrachromosomal events are colored green and interchromosomal events are colored orange.
