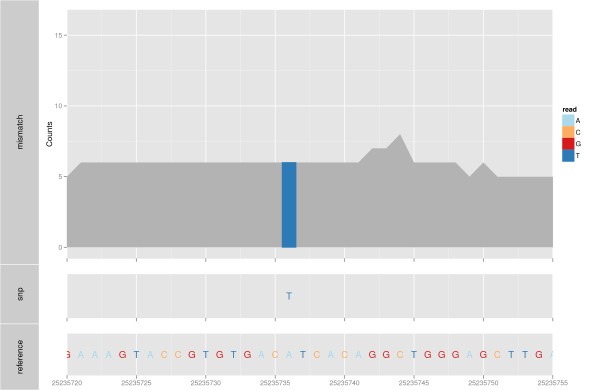
Figure 6.

Mismatch summary. An example of a mismatch summary plot, with associated variant calls. The top track shows a barchart of reference counts in gray and mismatched counts colored by the nucleotide. The middle track shows SNPs as letters, color coded also by nucleotide. There is one mismatch, 'T', that is different for all of the reads from the 'A' in the reference genome (bottom letter plot).
