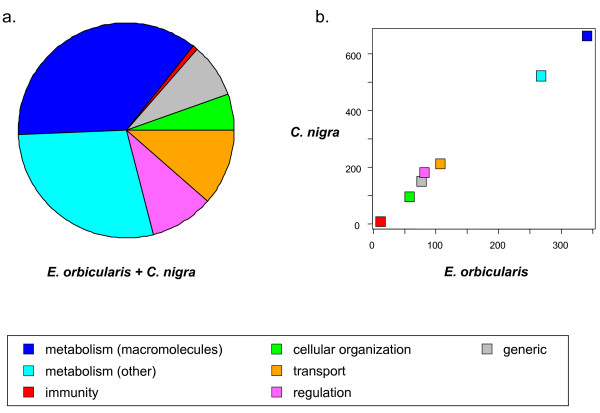
Figure 4.

Functional annotation of coding sequences analyzed in C. nigra and E. orbicularis. (a) Pie chart representing the total number of coding sequences from the two species in each category; (b) correlation of category-specific abundance between the two species. Only coding sequences for which we obtained both a GO-slim term annotation and a πN/πS estimate were included. The generic categories used in this figure were defined by grouping terms from the ‘biological process’ GO-slim ontology as indicated in Additional file 3: Table S1, second colon.
