
Figure 2.
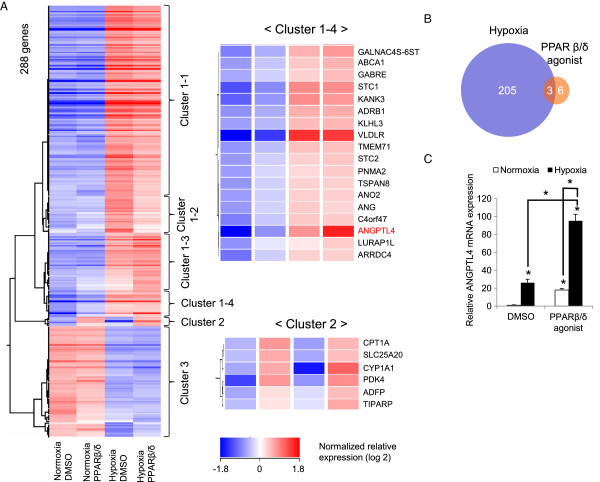
Genome-wide analysis of PPARβ/δ and/or hypoxia-induced genes in endothelial cells identified ANGPTL4 as the common target gene. (A) Left panel: clustering analysis performed using the selected genes. Right upper panel: genes with their expression profiles placed into the cluster 1-4, which included the genes that responded to both PPARβ/δ agonist and hypoxia. Right lower panel: genes and their expression profiles in cluster 2, which contained the genes induced by the PPARβ/δ agonist, but not hypoxia. (B) Venn diagram of the PPARβ/δ agonist and/or hypoxia-induced genes. Based on microarray analysis, after normalization and filtering, gene expression under PPARβ/δ agonist (GW501516 100 nM) or hypoxia (1% O2) stimulation (24 hours) in HUVECs was compared with no stimulation (DMSO + normoxia), and then genes that had a fold change ≥1.5 were selected. (C) Quantitative RT-PCR analysis of ANGPTL4 for both types of stimulation. HUVECs were stimulated with the PPARβ/δ agonist (GW501516 100 nM) and/or hypoxia (1% O2) for 24 hours. Data (mean ± standard deviation) are representative of two independent experiments with similar results. *P < 0.001 compared between the indicated conditions.