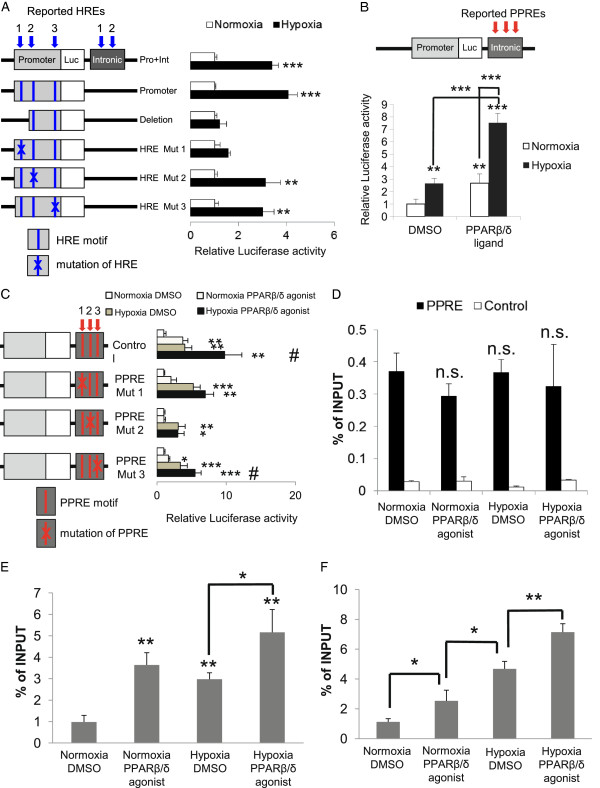
Figure 4.

Identification of the functional HRE and PPAR-response element on ANGPTL4, the quantity of PPARβ/δ binding to the third intron of ANGPTL4 and histone acetylation level of the response elements. (A) Reporter assay with HRE mutations in intronic regions in HUVECs. HUVECs were transfected and stimulated as shown in Material and methods. The reported HREs in the promoter and intronic region located in constructs and shown by the blue arrows with numbers. (B) HUVECs were transfected with the construct containing known PPAR-response elements (PPREs; red arrows in upper panel) and were stimulated with the PPARβ/δ agonist GW501516 (100 nM) and/or hypoxia (1% O2) for 24 hours. Comparison was done between the indicated conditions. (C) Reporter assay for PPRE mutations. Cells were transfected with each construct and stimulated with the PPARβ/δ agonist and/or hypoxia for 24 hours (as above). The reported PPREs are shown by the red arrows with numbers. Comparison was with the untreated condition, and #P < 0.05 compared to the hypoxic condition. (D) ChIP-PCR of PPARβ/δ under the four conditions. Location of primers is shown in Figure 3C. (E) ChIP-PCR of H3K27ac under the four conditions around the PPARβ/δ binding site. Primers were designed for an upstream region close to the PPARβ/δ binding site at the third intron of ANGPTL4 (Figure 3E). (F) ChIP-PCR of H3K27ac under the four conditions around the HIF1α binding site. Primers were designed for a downstream region close to the HIF1α binding site 2 kbp upstream of the TSS (blue open arrow in Figure 3E). Primers for ChIP-PCR are listed in Table S5 in Additional file 2. Comparison was with normoxia-DMSO sample or between indicated pairs. Data (mean ± standard deviation) are representative of three (A to C), or two (D and F) independent experiments with similar results. ***P < 0.001, **P < 0.01, *P < 0.05; n.s., not significant.
