Figure 5.

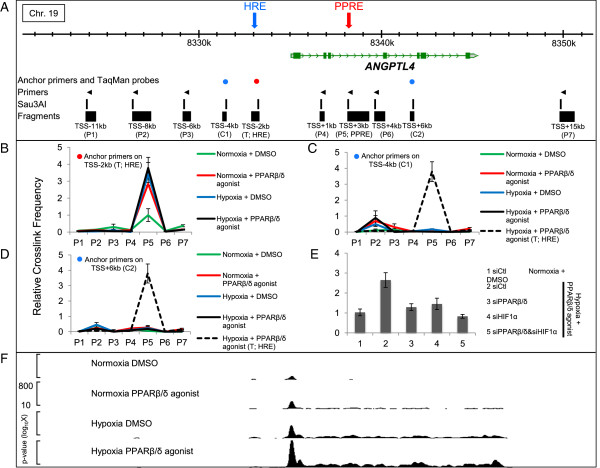
Chromatin conformation was changed at the ANGPTL4 locus by HIF1α and PPARβ/δ. (A) Schematic diagram of the ANGPTL4 gene locus and 3C experimental settings. The colored circles show the position of anchor primers and TaqMan probes (red for target anchor, blue for control anchor). Arrowheads show the positions of primers. The digestion sites of Sau3AI are shown with the generated fragments below. The distance from the TSS of ANGPTL4 is shown at the bottom with the primer name. The functional HRE and PPRE are shown with blue and red arrows. The genomic location on the chromosome based on the hg18 build is shown at the top. (B) 3C assays based on HRE fragment. Anchor primer and TaqMan probe were designed on HRE fragment and the other primers were designed for analyzing the crosslinking frequency of the HRE and the other fragments (Figure 5A). HUVECs were treated with four conditions, then the relative frequencies were compared among them. (C,D) 3C assays based on the control 1 (C) and control 2 (D) fragments. Anchor primer and TaqMan probe were designed on the fragment located 4 kb upstream of the TSS (C1), and on the fragment located 6 kbp downstream of the TSS (C2). The other primers are the same as in (B). To compare the data properly, the relative frequency data under dual stimulations in (B) are shown by the dotted line. Primers for 3C experiments (B-D) are shown in Table S3D in Additional file 2 and the locations of primers are shown in Figure 5A. (E) 3C assay of the target motif (HRE and PPRE) using siRNA against HIF1α and/or PPARβ/δ. HUVECs were transfected with siRNAs and, 48 h later, stimulated for 24 hours. (F) ChIP-seq analysis (RNA polymerase II) of ANGPTL4. Data (mean ± standard error of the mean) are representative of three independent experiments with similar results (B-E).
