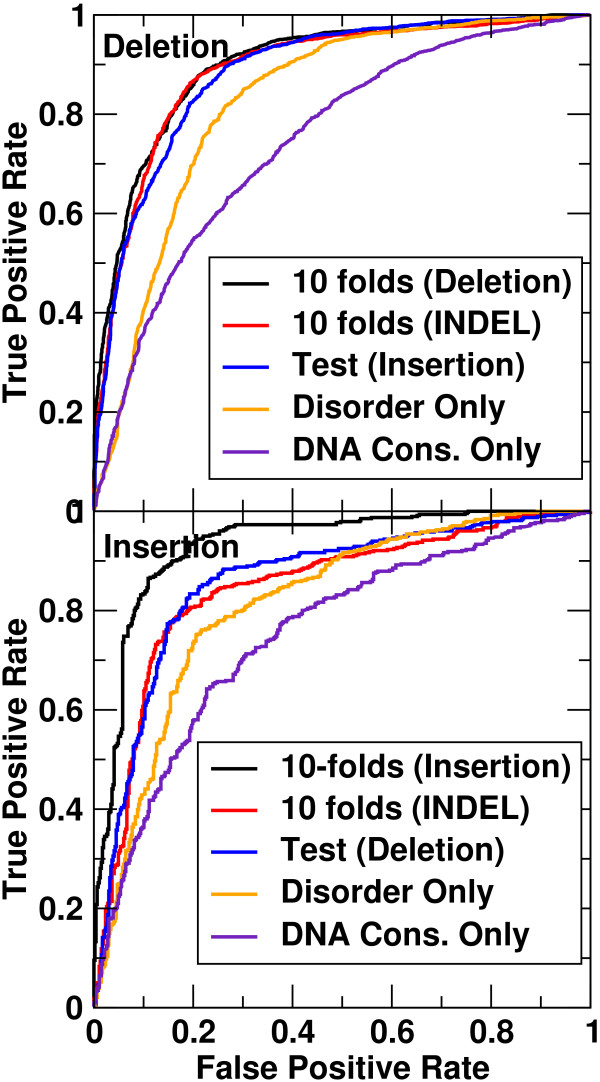
Figure 2.

The ROC curves for the microdeletion (top) and microinsertion (bottom) sets, respectively, by 10-fold cross-validation on the set (black), 10-fold cross-validation on both insertions and deletions (red), independent test by training on the microinsertions (top) or microdeletions (bottom) (blue), by disorder feature only (orange), and by DNA conservation score only (purple) as labeled.
