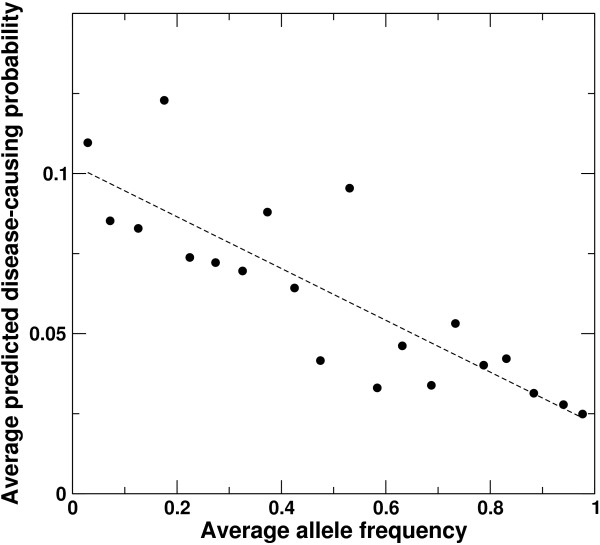
Figure 3.

The average predicted disease-causing probabilities as a function of the average allele frequency in the neutral indel dataset derived from the 1,000 Genomes Project data. This was done by dividing allele frequencies into 20 bins. The dashed line is from a linear regression fit. The correlation coefficient is -0.84.
