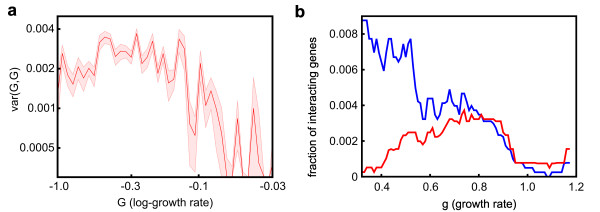
Figure 6.

Comparison between the traditional and the geometric definitions of epistasis (e and E, respectively). (a) Figure equivalent to Figure 2c, using the traditional definition of epistasis. (b) The fraction of genes interacting with a specific gene is a function of the growth rate effect of such gene. Only the 10,000 most interacting pairs the geometric definition (blue) and the traditional definition (red) are considered to be interactions.
