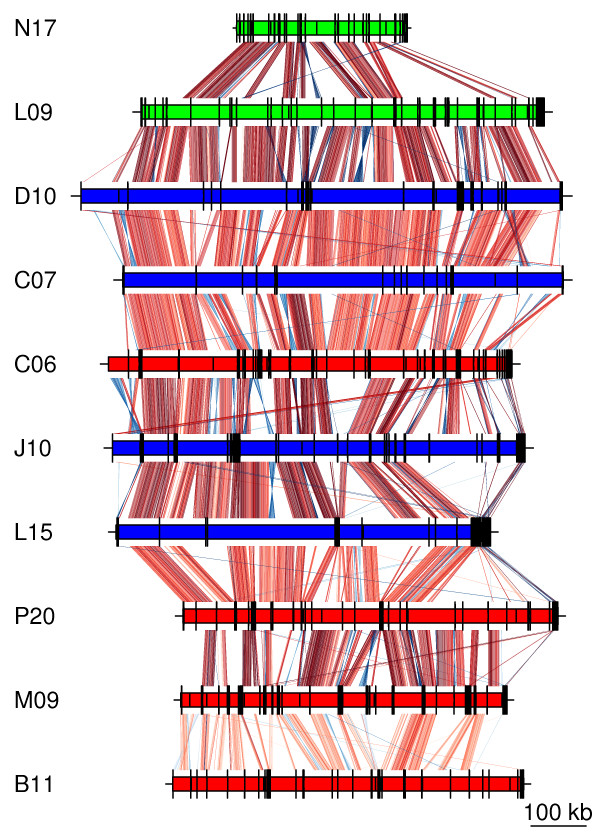
Figure 2.

Comparative genomics of the LD12 SAGs. The SAGs are colored to indicate lake of origin, as in Figure 1. The scaffold blocks are separated by black lines. The colored lines between each of the SAGs and the patchwork genome indicate sequence similarities, with the intensity of the color reflecting the e-value of the blastn hit.
