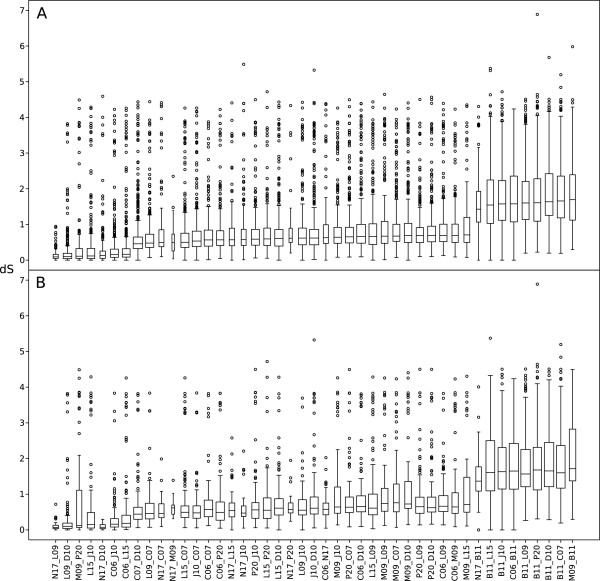
Figure 5.

Synonymous substitution frequencies. Boxplot of dS values of (A) 775 and (B) 179 genes for all possible pairwise combinations of the 10 SAGs, ordered by the median values estimated for the dataset of 775 genes. The width of the boxes is normalized by the number of genes used for the calculations for each pair of SAGs.
