
Figure 11.
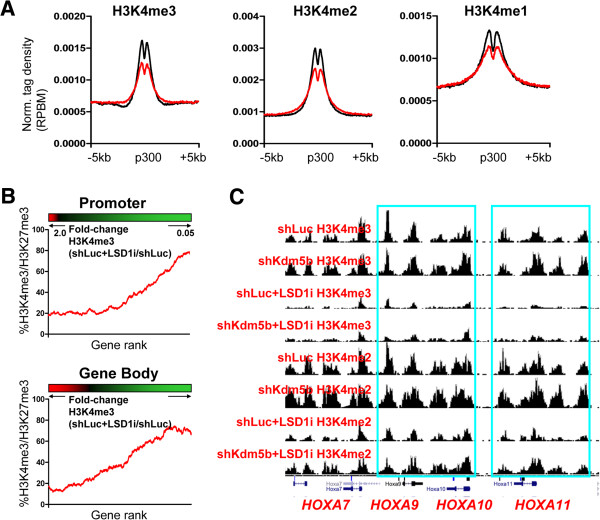
KDM5B and LSD1 regulate H3K4 methylation at promoters and enhancers in ES cells. (A) Average profile of H3K4me3/2/1 density at p300 enhancer regions in LSD1i-treated ES cells (red line) relative to shLuc ES cells (black line). RPBM, reads per base pair per million reads. (B) Relationship between changes in promoter and gene body H3K4me3 density and the percentage of genes with bivalent marks (red, increased H3K4me3; black, no-change in H3K4me3; green, decreased H3K4me3). (C) Genome browser view of H3K4me3 levels at HoxA cluster bivalent genes upon inhibition of LSD1 in ES cells.