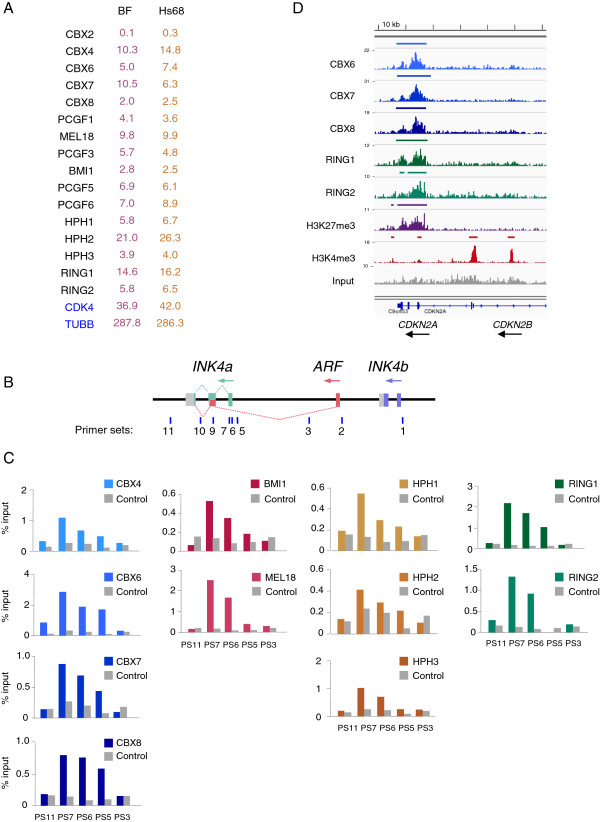
Figure 1.

Multiple PRC1 components have similar binding profiles at the CDKN2A locus. (A) Relative expression levels of the core PRC1 components in the BF and Hs68 strains of primary fibroblasts. The numbers are mean FPKM values from four independent RNA-sequencing analyses. CDK4 and TUBB are shown as controls. (B) Genomic organization of the human CDKN2A/B locus with colored boxes depicting the exons that encode p16INK4a, p14ARF and p15INK4b. The locations of primer sets used for ChIP analyses are shown below, numbered according to Bracken et al. [27]. The sequences are described in Additional file 6: Table S3. (C) Examples of ChIP data using antibodies against four Pc proteins (blue), two Psc proteins (pink), three Ph orthologs (orange) and both Sce proteins (green) using the indicated primer sets. Binding is shown as the percentage of input. Non-specific antibodies or pre-immune serum were used as controls as appropriate (shown in grey). (D) Screenshot showing DNA sequence tag densities at the CDKN2A locus following ChIP-sequencing with the indicated antibodies in BF fibroblasts. The maximum coverage for each track is shown on the left and a size bar is included above the IGV screenshot. ChIP, chromatin immunoprecipitation; kb, kilobase; FPKM, fragments per kilobase of gene per million fragments mapped; IGV, Integrative Genomics Viewer.
