
Figure 5.
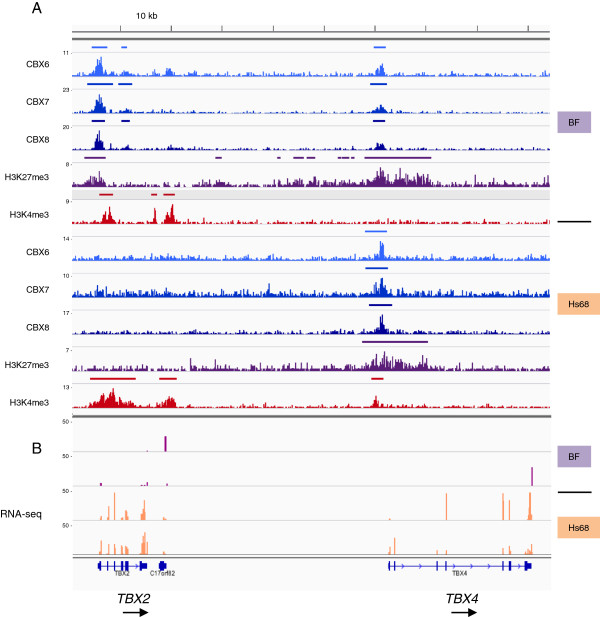
Correlation of ChIP-sequencing and RNA-sequencing data at the TBX2 and TBX4 loci. (A) Profiles of DNA sequence tag densities across the TBX2 and TBX4 loci following ChIP-sequencing with the indicated antibodies for BF and Hs68 cells. (B) Examples of duplicate RNA-sequencing analyses across the TBX2 and TBX4 loci for BF and Hs68 cells. kb, kilobase; RNA-seq, RNA-sequencing.