
Figure 6.
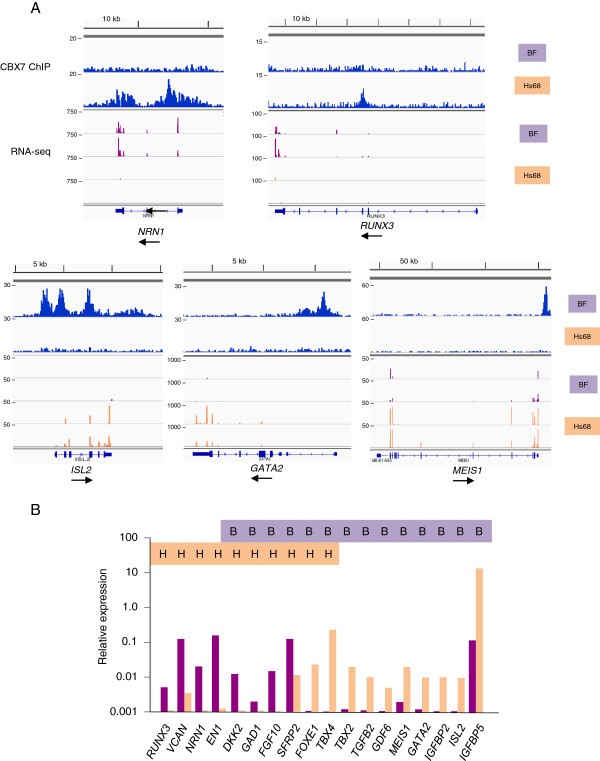
Correlation of ChIP-sequencing and RNA-sequencing in BF and Hs68 cells. (A) Comparison of CBX7 binding profiles (top tracks) and RNA-sequencing tag densities at the indicated loci in BF and Hs68 cells. For comparative purposes, the sequence tag densities are plotted on equivalent scales. (B) Reverse transcription and quantitative PCR validation of the RNA-sequencing data at the indicated loci. Relative expression levels in BF cells (purple) and Hs68 (tan) cells were calculated relative to RPS17 as an internal standard and plotted on a logarithmic scale. The color-coded B and H symbols above the graph indicate whether the locus is occupied by PRC1 complexes in BF (purple) or Hs68 (tan) cells. Note that DKK2, GAD1, FGF10, SFRP2, FOXE1 and TBX4 are PRC1 targets in both cell backgrounds. ChIP, chromatin immunoprecipitation; kb, kilobase; RNA-seq, RNA-sequencing.