
Figure 5.
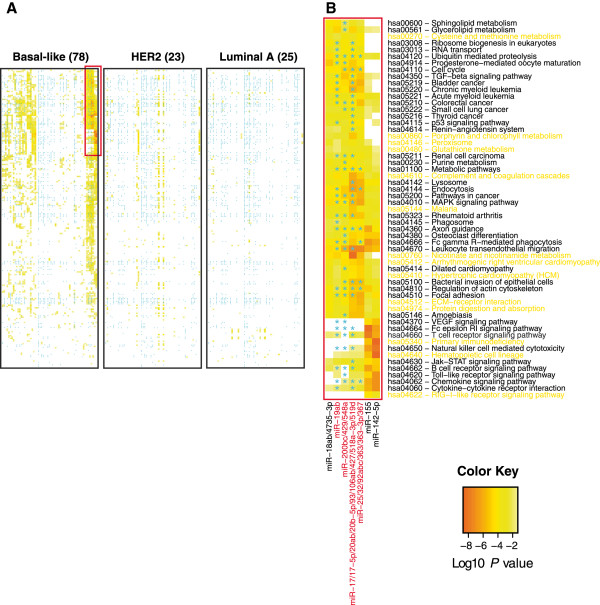
miRNA-KEGG pathway associations. Heatmaps depicting significant P values from GT correlating expression of miRNA families to genes belonging to KEGG pathways for different subtypes in [15]. Heatmaps for HER2 and luminal A subtype ordered according to the clustering of the basal-like subtype. Boxes labeled with stars illustrate presence of MP-PCLIP targets. Region selected by red outline represents area with highest concentration of significant P values seen in panel B. Color key depicts P values of associations. miRNAs in red include pathway gene associations with MP-PCLIP targets, while pathways in yellow do not.