
Figure 5.
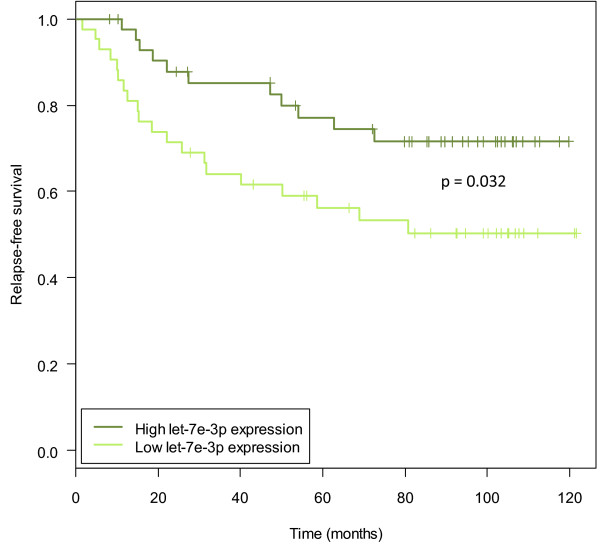
Kaplan-Meier curves showing relapse-free survival when dividing samples into high and low let-7e-3p expression groups. The ‘low’ group denotes samples with expression below the median (n = 43) and the ‘high’ group contains samples with expression above the median (n = 43). The P-value is from a log-rank test. The plot shows survival data of the discovery cohort.