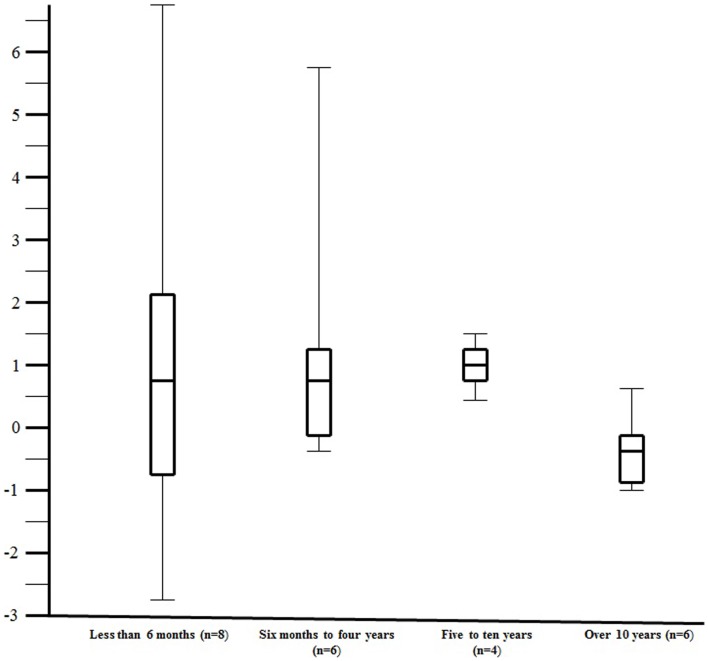
Figure 3.
The change in urine output (milliliters per kilogram per hour) over the 24 h of aminophylline therapy by age group. The figure illustrates the change in urine output (milliliters per kilogram per hour) over the 24 h of aminophylline therapy by age group. The change in urine output (milliliters per kilogram per hour) over the 24 h of aminophylline therapy is plotted along the y-axis. The x-axis contains the four age groups divided in approximately equal groups. The number of study patients assessed in age group is depicted by the “n =” within the parentheses. The center line within the “box” reflects the median while the ends of the “box” reflect the 25th and 75th percentile, respectively. The “whiskers” extending from the box reflect the entire range of values.

