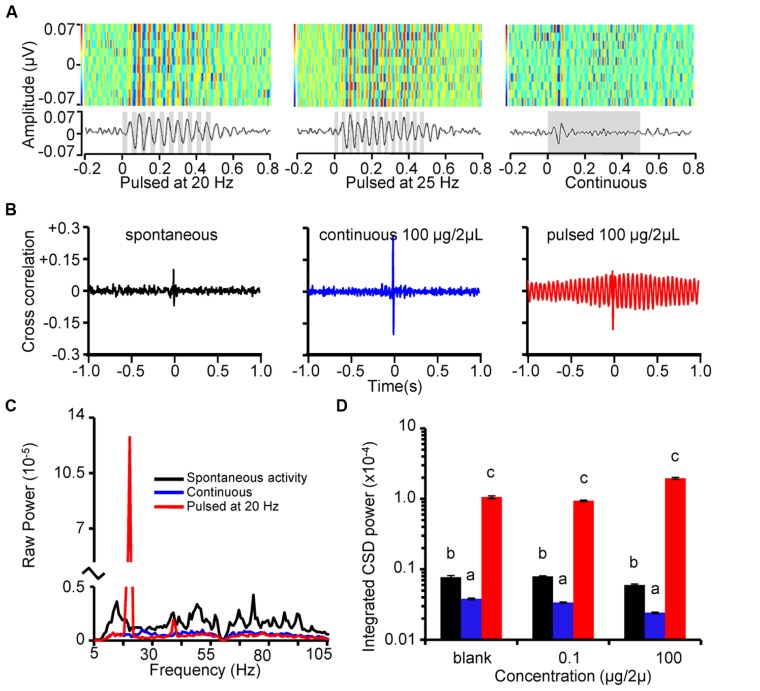
FIGURE 4.
Stimulus-driven LFP oscillations are strongly phase locked with unitary spiking. (A) Rasterized peri-stimulus LFPs (top) and corresponding histograms (below) for 10 repeats of 500 ms odor stimulation (1-decanol; inset gray bars represent stimulus). Each LFP trace was band pass filtered with a 5–80 Hz and a 60 Hz notch then converted to a one-dimensional row of the raster. Heat-map color-code indicate voltage peaks (reds) and valleys (blues). All 10 responses are aligned by stimulus onset and stacked to create a single composite panel. Note that the vertical striping of red and blue (voltage peaks and valleys, respectively) for the pulsed stimuli indicates a near perfect alignment of oscillations. Peri-stimulus histograms (below) are binned at 1 ms. Results are from the same animal and recording site and are in response to 20 Hz (left), 25 Hz (center) pulse trains and a continuous stimulation (right). (B) Example cross correlograms between LFPs and units during spontaneous activity (left), and in response to K6 (100 μg in 2 μL mineral oil) presented as a continuous stimulus (center), or a 20 Hz pulse train (right). (C) Mean cross spectral density across all possible analyzed cross correlations. Results based on 80 individually calculated cross correlations across 4 pulse tracking units, 4 LFP recording sites, and 5 stimulus repeats. (D) Mean integrated CSD power in the cross correlations around the pulsing frequency. Results are color coded as in B and broken down as a function of odor concentration. Inset letters indicate significant differences between spontaneous, continuous, and pulsed CSD power at 20 Hz. Analysis was performed independently for each concentration. Note that relative to spontaneous activity, continuous odor stimulation significantly decreased power whereas pulsed stimulation significantly increased power; this was true at each stimulus concentration (Tukey’s HSD; p < 0.05).

