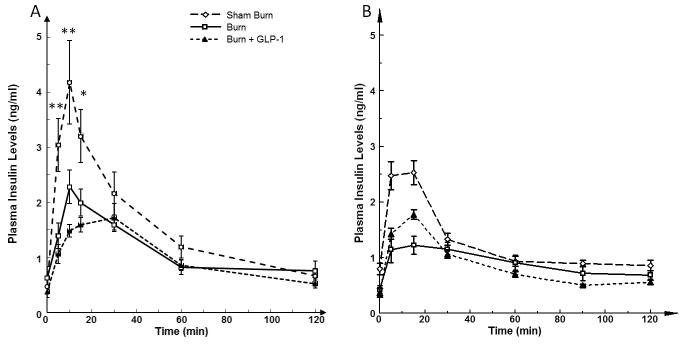
Figure 3.
A; Plasma levels of Insulin during IGGTT. There was no significant difference in fasting insulin levels among these three groups. IGGTT resulted in immediate increase in plasma insulin levels that were significantly different in all 3 groups of animals. The peak insulin level was significantly lower in the B group as compared to the SB group. Conversely, the peak insulin level in B group was significantly higher than that of the B+GLP group. 3B; Plasma Insulin Levels with IPGTT, Comparing 3A and 3B, the maximal plasma insulin level was much higher in IGGTT versus IPGTT in both SB and B groups. Such difference was not seen in both G+GLP groups.

