
Figure 4.
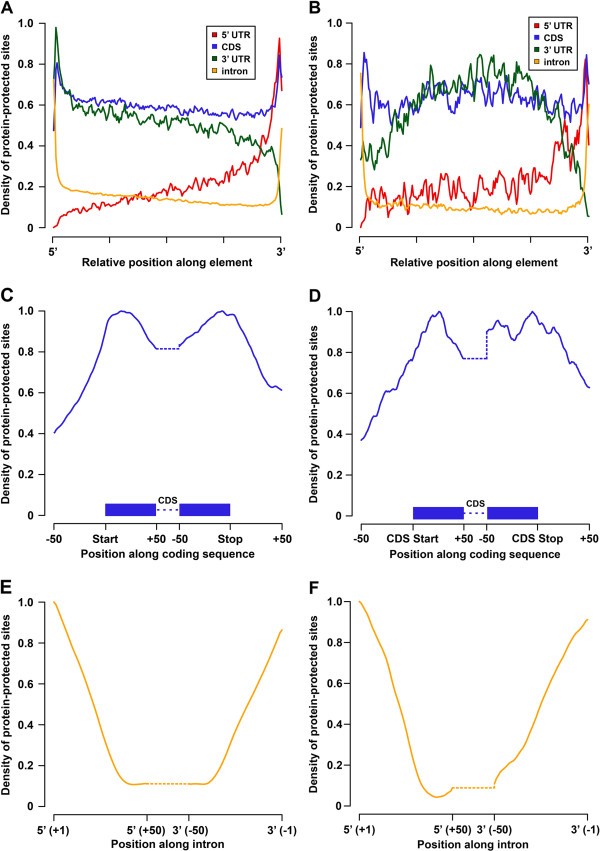
The landscape of protein-binding site density. (A,B) Average PPS density for formaldehyde (A) and UV (B) cross-linking experiments across 100 equally spaced bins in various genic regions. Values are normalized separately for each genic region (for example, intron). (C,D) Average PPS density for formaldehyde (C) and UV (D) cross-linking experiments within 50 nucleotides of CDS ends. (E,F) Average PPS density for formaldehyde (E) and UV (F) cross-linking experiments within the first and last 50 nucleotides of introns. Dotted lines in (C,D,E,F) represent the remaining (unanalyzed) length of each element. CDS, coding sequence; PPS, protein-protected site; UTR, untranslated region.